Sunday, October 27, 2013
JStockCharts - Update - High & Low Prices for predefined Time ranges
Sunday, June 23, 2013
JStockCharts Update: Combined series chart has been added to Comparable Counters.
Sunday, June 9, 2013
JStockChart: Update Notification - Parabolic SAR Indicator
Developed by Welles Wilder, the Parabolic SAR refers to a price-and-time-based trading system. Wilder called this the "Parabolic Time/Price System." SAR stands for "stop and reverse," which is the actual indicator used in the system. SAR trails price as the trend extends over time.The indicator is below prices when prices are rising and above prices when prices are falling. In this regard, the indicator stops and reverses when the price trend reverses and breaks above or below the indicator.
Sunday, May 26, 2013
JStockCharts Update : Stock Charts Comparison Tool & Mass Index Indicator
Stock Charts Comparison Tool
| Comparison Tool rendered on a 19" widescreen monitor |
Actually there is no theoretical limitation to the number of shares that can be compared, but I have put up this limitation of 06 counters to render charts more clearly on single monitor systems, I'm afraid most people use notebook computers hence even 06 charts wouldn't be clearly analyzable. Feel free to try this an new ideas and suggestions are always welcome and would be highly appreciated.
New Indicator : Mass Index
Developed by Donald Dorsey, the Mass Index uses the high-low range to identify trend reversals based on range expansions. In this sense, the Mass Index is a volatility indicator that does not have a directional bias. Instead, the Mass Index identifies range bulges that can foreshadow a reversal of the current trend.
Sunday, May 19, 2013
JStockCharts Update- Ease of Movement Indicator
Ease of Movement Indicator (EMV)
Developed by Richard Arms, Ease of Movement (EMV) is a volume-based oscillator that fluctuates above and below the zero line. As its name implies, it is designed to measure the "ease" of price movement. Arms created Equivolume charts to visually display price ranges and volume. Ease of Movement takes Equivolume to the next level by quantifying the price/volume relationship and showing the results as an oscillator. In general, prices are advancing with relative ease when the oscillator is in positive territory. Conversely, prices are declining with relative ease when the oscillator is in negative territory.
Sunday, May 5, 2013
JStockCharts update- Aroon Indicator & StochRSI Charts
Aroon Indicator
Developed by Tushar Chande in 1995, Aroon is an indicator system that determines whether a stock is trending or not and how strong the trend is. "Aroon" means "Dawn's Early Light" in Sanskrit. Chande chose this name because the indicators are designed to reveal the beginning of a new trend. The Aroon indicators measure the number of periods since price recorded an x-day high or low.
StochRSI
Developed by Tushard Chande and Stanley Kroll, StochRSI is an oscillator that measures the level of RSI relative to its high-low range over a set time period. StochRSI applies the Stochastics formula to RSI values, instead of price values. This makes it an indicator of an indicator. The result is an oscillator that fluctuates between 0 and 1.
Sunday, April 28, 2013
JStockCharts update- WatchList & Percentage Price Oscillator Chart
If you are new to JStockCharts please refer to this post.
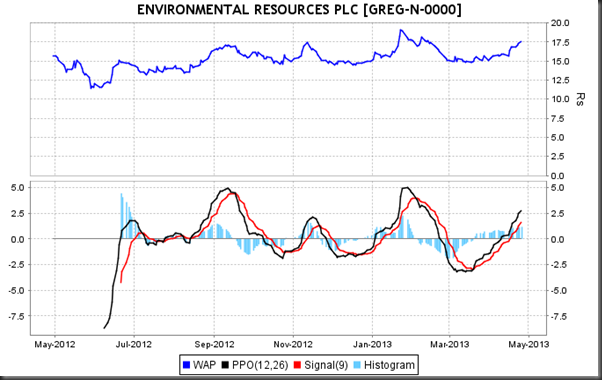
Technical Indicator – PPO ( Percentage Price Oscillator)
The Percentage Price Oscillator (PPO) is a momentum oscillator that measures the difference between two moving averages as a percentage of the larger moving average. As with its cousin, MACD, the Percentage Price Oscillator is shown with a signal line, a histogram and a centerline. Signals are generated with signal line crossovers, centerline crossovers and divergences. Because these signals are no different than those associated with MACD, this article will focus on a few differences between the two. First, PPO readings are not subject to the price level of the security. Second, PPO readings for different securities can be compared, even when there are large differences in the price.Reference : StockCharts.com
___________________________________________________________________
Official Site
http://wkhhost.hostoi.com/JChartsWeb/index.html
Direct download
https://sourceforge.net/projects/jchartscse/files/latest/download
WAP File mailing-list(Please subscribe to receive daily WAP File)
https://lists.sourceforge.net/lists/listinfo/jchartscse-wapfeed
____________________________________________________________________________
Monday, April 8, 2013
Introducing JStockCharts - Technical Analysis tool for Equity trading in Colombo Stock Exchange (CSE)
Available chart types
Following chart types are available if you select over 03 months time period. This list grows frequently so make sure to subscribe to my blog to receive updates about new additions to the application and chart types.
Sample Charts
![]() |
| Price & Turnover |
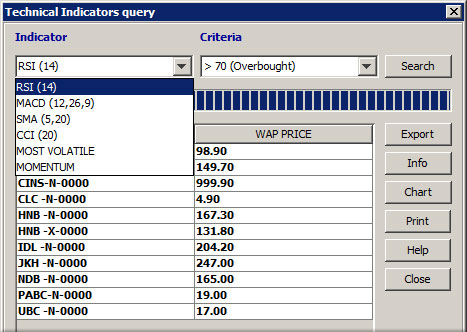
Using this tool users can query for counters which meet certain criteria such as , this list keeps getting longer with weekly updates. (subscribe to the official mailing-list to receive update notifications)
- MACD crossing the signal line from below , from above etc
- RSI overbought/oversold counters
- SMA - Cross from below/above
- CCI - overbought/oversold
- Volatility
- Momentum
- New 52Week High/Low
Historical Prices
- View OHLC , Turnover and Volume data for a specific counter for a specific date or for a date range and all counters for a specific date or date range.
- View High Low prices for all counters or a selected counter (Highs & Lows) ,
- View if a selected counter recorded a given gain percentage over a specific time period. (Gain Analyzer)
Line (Combined) Chart type
Official Site
http://wkhhost.hostoi.com/JChartsWeb/index.html
Direct download
https://sourceforge.net/projects/jchartscse/files/latest/download
WAP File mailing-list(Please subscribe to receive daily WAP File)
https://lists.sourceforge.net/lists/listinfo/jchartscse-wapfeed
_________________________________________________________________
System Requirements:
*. Java Run-time version 7 or above (Download)
*. Supported Operating Systems : Windows XP or above, Linux , MAC OS X, Solrais
Installation
No installation is required , you can use this as a portable application.
1. Download JStockCharts.rar by visiting the above direct download link.
2. Extract the downloaded file in to a desired location (e.g C:\)
3. Add shortcut to the JStockCharts.exe file to the desktop.
4. Run the application using the above shortcut.
Enjoy!!
Google+
Monday, September 24, 2012
Average Cost Calculator - Redefined
Sunday, June 10, 2012
Profit_Loss Calculator major UI Update
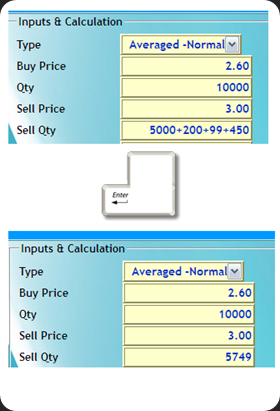
On this week I added a simple but useful feature. as you know orders aren’t always filled in full quantities for an example if we place a sell order for some 1000 shares this quantity may get executed by parts of 100,500,233,…etc so In such events you don’t need to calculate how many shares have been sold separately. In the sell quantity text fields just enter the quantities separated by ‘+’ operator and the total sold quantity will be calculated on the fly. (see the image below)
Furthermore I have added profit calculation and Quantity calculation features. which facilitates investor and alike to make their trading experiences more fruitful. More updates are coming up. Enjoy folks. Happy trading.
Sunday, May 20, 2012
Introducing - Average cost calculator for CSE equity trading
Friday, June 25, 2010
Sudoku Puzzle Solver : minor update
Sudoku puzzle solver is now equipped with few additions in UI and code to make it easier for users to solve/make puzzles. in new UI there is an option to check in menu bar Settings –> Indicate constraints . when checked and user hovers mouse over a cell program highlights the row , column and box related to the cell. further more tooltip pops up and shows possible values which can be entered according to sudoku game rules for the particular cell.
EDIT: 26/06/10
UI Update:
If you have Java Run time installed on your system , download and extract the Archive and run Sudoku.jar by double clicking on it or using command line .
java –jar Sudoku.jar.
Tuesday, May 4, 2010
Sudoku Puzzle Solver – Look and Feel
check my previous posts on Sudoku puzzle solver for more information about the program.
Sunday, May 2, 2010
JDownloadManager ►►
JDownload manager is yet a primitive download manager which can be used to download multiple files simultaneously. It only supports HTTP connections hence It is unable to handle FTP/Proxy connections as of now. Developed entirely using Java/Swing uses Multithreading to download files simultaneously. Downloads can be paused/resumed. browser integration feature is not supported yet hence the user has to add the download link manually.
PS: source can be provided to anyone who is interested in extending this program to a more advanced download manager.
Sunday, April 25, 2010
Text Analyser Extended
Tuesday, April 20, 2010
Text Analyser | Not just another Update
This post is an extension to my previous posts.
- 2010/04/text-analysis-gui.html
- 2010/04/text-analyser-update.html
- 2010/04/text-analyser-major-update.html
_____________________
...
Saturday, April 17, 2010
►◄ My Sudoku puzzle solver ►◄
Friday, April 16, 2010
Text Analyser | Major Update
- Enables user to enter texts directly and analyse.
- Menu bar added.
- Single letter word bug fixed.
Thursday, April 15, 2010
Sudoku puzzle solver | Update
Previous release
Saturday, April 10, 2010
Text Analyser | Update
This post refers to these previous posts.
Text Analysis | My Approach
Text Analysis | GUI
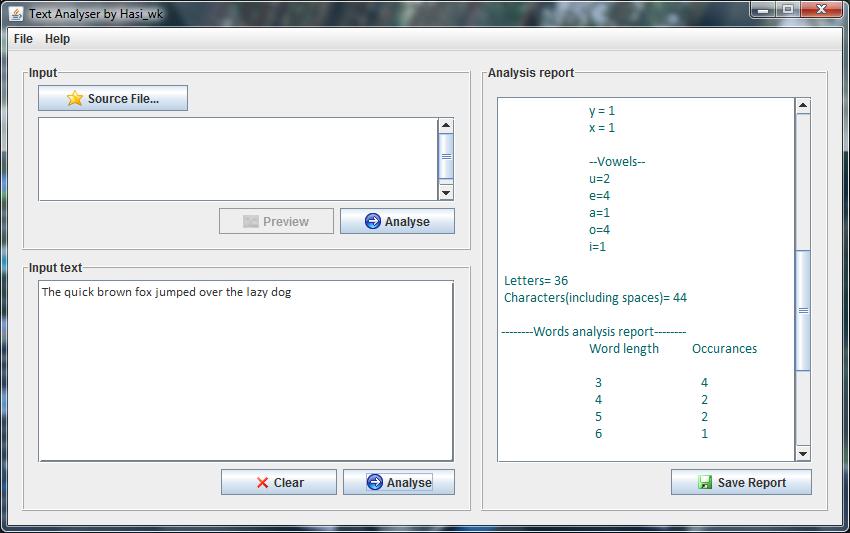
Update: Fixed several issues ans added preview feature. Now the program reports occurances of vowels.


http://slots.to/