Social Icons

Saturday, May 25, 2013

JD-GUI , A lightweight java decompiler


JD-GUI is a standalone graphical utility that displays Java source codes of “.class” or ".jar" files . You can browse the reconstructed source code with the JD-GUI for instant access to methods and fields. This is a free tool for non-commercial use. I can guarantee you it's fast and reliable tool. I have been using it for couple weeks now and I'm totally contented with it.
JD-GUI is free for non-commercial use. This means that JD-GUI shall not be included or embedded into commercial software products. Nevertheless, this project may be freely used for personal needs in a commercial or non-commercial environments.


JD-GUI is can be downloaded by visiting it's official site and is available for Windows, Linux and Mac platforms. 

Main Features

  • JD-Core and JD-GUI are written in C++. This allows an extremely fast decompilation and a display.
  • JD-Core does not require the Java runtime environment for its functioning, therefore no special setup is required.
  • JD-Core works with most current compilers including the following:
    • jdk1.1.8
    • jdk1.3.1
    • jdk1.4.2
    • jdk1.5.0
    • jdk1.6.0
    • jdk1.7.0
    • jikes-1.22
    • harmony-jdk-r533500
    • Eclipse Java Compiler v_677_R32x, 3.2.1 release
    • jrockit90_150_06
  • JD-Core supports the following new features of Java 5:
    • Annotations
    • Generics
    • Type “enum”
  • JD-GUI supports Drag and Drop.
  • JD-GUI supports JAR files.
  • JD-GUI displays color coded Java source code.
  • JD-GUI allows you to browse the “class” files hierarchy.
  • JD-GUI displays “log” files, and allow you to decompile “class” files appearing in Java stack traces.
  • JD-Core, JD-GUI and JD-Eclipse use the excellent cross-platform wxWidgets toolkit.


Sunday, May 19, 2013

JStockCharts Update- Ease of Movement Indicator


Ease of Movement Indicator (EMV)


Developed by Richard Arms, Ease of Movement (EMV) is a volume-based oscillator that fluctuates above and below the zero line. As its name implies, it is designed to measure the "ease" of price movement. Arms created Equivolume charts to visually display price ranges and volume. Ease of Movement takes Equivolume to the next level by quantifying the price/volume relationship and showing the results as an oscillator. In general, prices are advancing with relative ease when the oscillator is in positive territory. Conversely, prices are declining with relative ease when the oscillator is in negative territory.


JStockCharts provides 14 day SMA of EMV. Users must select a period higher than or equal to 03 month to render this chart type.

Further I have optimized the code of WatchList to ensure more effectiveness of the data displayed in it. for an example I have added a no change color (orange) for two types of changes in closing price. first , If there were no trades for the last trading day or previous trading date for a given counter, there is no point of calculating the change hence such counters rendered in no change color. and second is the most obvious , of which closing prices were same for the two days. 
In the following screen capture HSIG's closing price shows as 0.00 because it hasn't been traded for the last updated trading date. other three counter's are self explanatory.


___________________________________________________________________
Official Site

Direct download

WAP File mailing-list(Please subscribe to receive daily WAP File)
___________________________________________________________________


Sunday, May 5, 2013

JStockCharts update- Aroon Indicator & StochRSI Charts


Aroon Indicator
Developed by Tushar Chande in 1995, Aroon is an indicator system that determines whether a stock is trending or not and how strong the trend is. "Aroon" means "Dawn's Early Light" in Sanskrit. Chande chose this name because the indicators are designed to reveal the beginning of a new trend. The Aroon indicators measure the number of periods since price recorded an x-day high or low.


StochRSI
Developed by Tushard Chande and Stanley Kroll, StochRSI is an oscillator that measures the level of RSI relative to its high-low range over a set time period. StochRSI applies the Stochastics formula to RSI values, instead of price values. This makes it an indicator of an indicator. The result is an oscillator that fluctuates between 0 and 1.


___________________________________________________________________
Official Site

Direct download

WAP File mailing-list(Please subscribe to receive daily WAP File)
____________________________________________________________________________


Sunday, April 28, 2013

JStockCharts update- WatchList & Percentage Price Oscillator Chart


If you are new to JStockCharts please refer to this post.

I have been working on a way to enable users to save his favorite/holding shares and daily monitor their trading summary through a single window. The Latest feature of the JStockCharts , WatchList enables users to accomplish this task. It simply provides a window to add/remove your desired shares to the table on the right side, once you updated the latest price list to the application you can go ahead and analyze the trading summary of the shares in your watchList easily by clicking the ico_alpha_ClipboardEdit_24x24 icon in the toolbar or by going through Tools menu.

wl

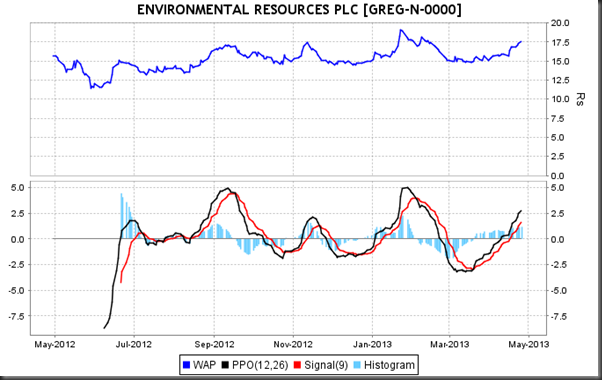
Technical Indicator – PPO ( Percentage Price Oscillator)
The Percentage Price Oscillator (PPO) is a momentum oscillator that measures the difference between two moving averages as a percentage of the larger moving average. As with its cousin, MACD, the Percentage Price Oscillator is shown with a signal line, a histogram and a centerline. Signals are generated with signal line crossovers, centerline crossovers and divergences. Because these signals are no different than those associated with MACD, this article will focus on a few differences between the two. First, PPO readings are not subject to the price level of the security. Second, PPO readings for different securities can be compared, even when there are large differences in the price.
Reference : StockCharts.com
This useful indicator charts are available for over 03 Months periods.

ppo

___________________________________________________________________
Official Site
http://wkhhost.hostoi.com/JChartsWeb/index.html

Direct download
https://sourceforge.net/projects/jchartscse/files/latest/download

WAP File mailing-list(Please subscribe to receive daily WAP File)
https://lists.sourceforge.net/lists/listinfo/jchartscse-wapfeed
____________________________________________________________________________

Monday, April 8, 2013

Introducing JStockCharts - Technical Analysis tool for Equity trading in Colombo Stock Exchange (CSE)


JStockCharts is a java based charting application with added features such signal generator and historical price viewer, chart comparison tool. Supports all widely used technical indicators. The system uses a local database to which a price list (WAP File) shall be uploaded daily. The file can be obtained by subscribing to the wap feed mailing-list.


Available chart types
Following chart types are available if you select over 03 months time period. This list grows frequently so make sure to subscribe to my blog to receive updates about new additions to the application and chart types.


Sample Charts
Price & Turnover

Relative Strength Index

Ease of Movement
       

Candlestick Chart


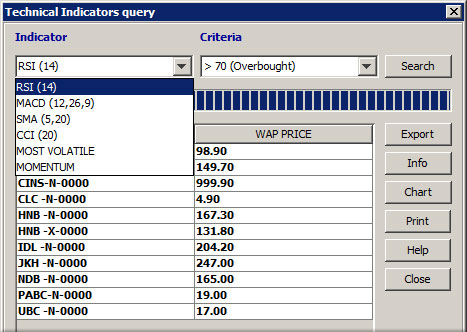
Technical indicator value generator

Using this tool users can query for counters which meet certain criteria such as , this list keeps getting longer with weekly updates. (subscribe to the official mailing-list to receive update notifications)

  • MACD crossing the signal line from below , from above etc
  • RSI overbought/oversold counters
  • SMA - Cross from below/above
  • CCI - overbought/oversold 
  • Volatility
  • Momentum
  • New 52Week High/Low


Historical Prices

This tool enables users to

  • View OHLC , Turnover and Volume data for a specific counter for a specific date or for  a date range and all counters for a specific date or date range. 
  • View High Low prices for all counters or a selected counter (Highs & Lows) ,
  • View if a selected counter recorded a given gain percentage over a specific time period. (Gain Analyzer)


Counter Comparison Tool

This too enables users to compare various shares in a single window. select shares , select a chart type , select a grid type and you are provided with multiple charts withing the same container. Also users are able to draw line charts of different counters in the same plot (Line (Combined)).


Line (Combined) Chart type
_________________________________________________________________
Official Site
http://wkhhost.hostoi.com/JChartsWeb/index.html

Direct download
https://sourceforge.net/projects/jchartscse/files/latest/download

WAP File mailing-list(Please subscribe to receive daily WAP File)
https://lists.sourceforge.net/lists/listinfo/jchartscse-wapfeed
_________________________________________________________________

System Requirements:
*. Java Run-time version 7 or above (Download)
*. Supported Operating Systems : Windows XP or above, Linux , MAC OS X, Solrais

Installation
No installation is required , you can use this as a portable application.

1. Download JStockCharts.rar by visiting the above direct download link.
2. Extract the downloaded file in to a desired location (e.g C:\)
3. Add shortcut to the JStockCharts.exe file to the desktop.
4. Run the application using the above shortcut.

Enjoy!!

Google+ 
 
 
Blogger Templates http://slots.to/