Social Icons

Saturday, October 25, 2014

New Additions to Financial Calculators- Average Cost Calculator & Consolidated Portal


Hey there Fellow readers, After an hectic period immersed in studies I have some time to look back into Trading calculators one of these days. Hence fresh improvements in my projects can be expected in coming weeks. First of such improvements goes in to Average Cost calculator (AVC), wherein I have made major overhaul in the code. So the changes may not be apparent. But the UI looks good , the code looks good so I feel much better. And I'm pretty confident that It could be made to a more robust application. Major changes was made to JS code to optimize and avoid redundancies. 
Major Addition to the AVC is the reverse calculation of the average price, that is users are able to calculate the quantity to be bought to average a specific counter's average price to a desired amount
For an example let's say an investor has 1000 shares of X at a cost of 2.50 and let's also assume the current market price of X is around 2.00. He would like to average down his cost of X to 2.30 and ponders what is the quantity he ought to buy to get his cost down to 2.30. The result can be easily obtained using the reverse calculation. 
And also I have put together a single web page where by users can access all the calculators I have developed. You can access it here.


Saturday, August 9, 2014

BIT Semester 05 - Recommended Readings - Ebooks - Download


                  I have included following E Books in the shared folder (link below) which are recommended for 5th Semester of BIT degree program conducted by UCSC, Please share this post among fellow students and keep in touch with the blog for updates of this list since I couldn't find all the recommended books. If you have any trouble downloading any of the files please let me know. 


Sunday, August 3, 2014

BIT Semester 03 (New Syllabus) - Recommended Readings - Ebooks - Download


Please note that the following references list was obtained from the syllabuses of past years, This year references may subject to change and new subjects are bound to be introduced. Upon recieving the new syllabuses I shall update this list and add new ebooks accordingly. Since It might take few months to obtain VLE access for 03 rd Semester I thought we better off start somewhere ,because time is absolutely of the essence. The following Ebooks are currently available to download.
Updated on 30th August 2014 with new syllabus books.


  • Sams Teach Yourself UML is 24 hours By  Joseph Schmuller
  • UML Bible by Tom Pender   John Wiley & Sons © 2003 (940 pages) 
  • Rational Unified Process, The: An Introduction, Third Edition By Philippe Kruchten 
  • Systems Analysis and Design Methods by Jeffrey L. Whitten, Lonnie D. Bentley, 7th edition,Tata McGraw-Hill, 2007.
  • SOFTWARE ENGINEERING Ninth Edition Ian Sommerville
  • Software engineering : a practitioner’s approach / Roger S. Pressman. — 7th ed.
  • Schaum's - Ayres F.J., Mendelson E. - Calculus.pdf
  • Schaums Easy Outlines Probability And Statistics (2002).pdf
  • Schuam’s Outline Series, Theory and Problems of Matrices by Frank Ayres, JR, McGraw-Hill 
  • Vector Algebra by Shanti Narayan, S.Chand and Company Ltd, New Delhi 
  • Visual Modeling with_Rational Rose 2002 and UML
  • Addison Wesley - The UML User Guide
  • Human Computer Interaction - 3rd Edition by - ALAN DIX_ JANET FINLAY new
  • Designing Interactive Systems: People, Activities, Contexts, Technologies
  • by David Benyon  
  • new            
  • PHP, MySQL, JavaScript & HTML5 All-in-One For Dummies 
  • Steve Suehring, Janet Valade 
  • new

Download from Dropbox


Sunday, June 1, 2014

Easily configure a web server (PHP/MySql) with XAMPP


XAMPP, by Apache Friends, is known as an installable Apache distribution, containing everything you need to get a server up and running on your own PC. Essentially, this package includes several applications and services all bundled together for fast and easy configuration, such as Apache, MySQL, PHP, OpenSSL, FileZilla FTP server, and more. This web server kit has recently reached version 1.8 and comes loaded with various improvements and fixes as well as preliminary support for Mac OS X and Solaris.


XAMPP shall be of particular use to BIT second semester students as well , since Database systems I requires students to practice bunch of SQL queries , MySQL is the choice of DBMS since ORACLE is kind heavyweight and a commercial DBMS. Using XAMPP it's easy to set up and configure MySQL instances on your local computer. I myself using XAMPP to practice queries for this subject. I have found it a lightweight , hassle free solution. hence I hereby recommend anyone to try XAMPP bundle without hesitation. It's easy to use. Once installed you can use phpMyAdmin to setup database or use the window command prompt or linux terminal to run DML/DDL queries. in window simple add "C:\xampp\mysql\bin" to your PATH variable and you are good to go.

Run XAMPP contol panel and start MySQL service.

Make sure to create a password for the user root as follows

Open the command prompt (cmd) Login to mysql terminal using root

mysql -u root

change the password using the following query

update user set password=PASSWORD("NEW_PASSWORD_HERE") where User='root';


Download XAMPP  ( Note: If you are using Windows XP , make sure to  choose version 1.8.2)

Thursday, May 1, 2014

Sublime Text : The Text editor you'll fall in love with.


(JS file of the ProfitLossCalculator opened using Sublime Text)

Sublime Text is not just a text editor It's a powerful programmers' tool with slick interface, unique feature which are not available in any other code editor.It's really awesome that I've been using this for a while and highly recommend to all the programmers out there. It won't serve you as highly sophisticated integrated development environment but it'll make coding fun.

Most apparent one of the features available in Sublime Text is the document preview section on the right hand corner of the editor, which enable users to easily navigate up and down through long source codes without scrolling up and down over and over again. It's nifty and time saving,  you got to admit. 


Sublime text also includes auto fill feature as depicted in the screenshot above, mind you this is not "Intellisense" which is available in Visual Studio/Netbeans, nevertheless it can help save you lot of keystrokes by remembering the stuff you already typed in.
Syntax highlighting for various languages are available built-in as depicted in the screen shot below, and also various color themes to choose from.


A few most prominent feature are listed below.

Goto Anything

Use Goto Anything to open files with only a few keystrokes, and instantly jump to symbols, lines or words.
Triggered with Ctrl+P, it is possible to:
  • Type part of a file name to open it.
  • Type @ to jump to symbols, # to search within the file, and : to go to a line number.

Distraction Free Mode

When you need to focus, Distraction Free Mode is there to help you out. Distraction Free Mode is full screen, chrome free editing, with nothing but your text in the center of the screen. You can incrementally show elements of the UI, such as tabs and the find panel, as you need them.

You can enter Distraction Free Mode using the View/Enter Distraction Free Mode menu.

Split Editing

Get the most out of your wide screen monitor with split editing support. Edit files side by side, or edit two locations in the one file. You can edit with as many rows and columns as you wish.
  • Take advantage of multiple monitors by editing with multiple windows, and using multiple splits in each window.
  • Take a look at the View/Layout menu for split editing options. To open multiple views into the one file, use the File/New View into File menu item.

Cross Platform

Sublime Text is available for OS X, Windows and Linux. One license is all you need to use Sublime Text on every computer you own, no matter what operating system it uses.

Sublime Text uses a custom UI toolkit, optimized for speed and beauty, while taking advantage of native functionality on each platform.

Enter the official web site here to download Sublime Text. Happy Coding.!

Monday, April 14, 2014

BIT Semester 04- Recommended Readings (New Syllabus 2015) - Ebooks - Download


 I have included following E Books in the shared folder (link below) which are recommended for 4th Semester of BIT degree program conducted by UCSC, Please share this post among fellow students and keep in touch with the blog for updates. If you have any trouble downloading any of the files please let me know. 
    New Syllabus recommended readings have been uploaded. Mind you the editions might not be the exact ones mentioned in the syllabus. 
     
newly added: 28 March,2015
  • Data Structures and Problem solving using Java Mark Allen Weiss, 4th Edition, 2006
  • “Managing Information Technology Projects” Kathy Schwalbe, Sixth Edition
  • Computer Networking, A Top-Down Approach, James F. Kurose & Keith W. Ross, 6e(2012)
  • William Stallings, Data and Computer Communications, 8e
  • Mobile Communications, Jochen Schiller, Second Edition, Addison Wesley, 2003
  • “Software Project Management” Bob Hughes and Mike Cotterell, Fourth Edition\
  • Essential Scrum Practical Guide to the Most Popular Agile Process, Kenneth S. Rubin
  • The Art of Agile Development, James Shore and Shane Warden
  • The Agile Software Development Series Cockburn * Highsmith Series Editors


Download from Dropbox

Sunday, April 13, 2014

JStockCharts Update - Gain Analyzer for Historical prices


After passing it's thousand downloads milestone, JStockCharts is keep getting updated continuously with fresh features which are not available in other applications. Historical Prices window has been added with a new tab to analyze historical price data to see how a selected counter recorded a given gain percentage or a higher value. It is my utmost joy to fulfill my users various requests and this is indeed one of such requests. This feature can possible go a long way with your valuable suggestions. I humbly expect them. Enjoy!


___________________________________________________________________
Official Site

Direct download

WAP File mailing-list(Please subscribe to receive daily WAP File)
___________________________________________________________________

Saturday, March 29, 2014

BIT Semester 02 -Recommended Readings - Ebooks - Download


It was without a doubt a cumbersome task to find the Electronic versions of recommended books for BIT UCSC Semester 01 but it was harder to find semester 02 ones, hence I thought of sharing what I have found for the benefit of fellow students who following BIT in UCSC. I haven't been able to find all the books recommended by UCSC , but I'll update the list once I have found others on due course. 

I have included following E Books in the shared folder (link below), Please share this post among fellow students and keep in touch with the blog for I shall upload other E books as soon as I found them.

+------------------------------------------------------ Upload log----------------------------------------------------------+
05 April 2014 : Uploaded "Systems Analysis and Design Methods by Jeffrey L. Whitten and Lonnie D. Bentley."

01 June 2014 : Uploaded "Java: The Complete Reference Book by Herbert Schildt"

15 June 2014: Uploaded  "Computer Program Design by Elizabeth A. Dickson, Tata McGraw-Hill Edition 2002"
+------------------------------------------------------------------------------------------------------------------------------+


Sunday, October 27, 2013

JStockCharts - Update - High & Low Prices for predefined Time ranges


JStockCharts has just been improved with a new update to Historical Prices tool, High/Low prices. Using the tool users can search for High/Low prices and their respective traded dates for predefined time periods such as 01 Month, 06 Months, 01 Year and All Time of selected share or of all currently trading shares. Prices are obtained from OHLC data published by CSE. Neither VWAP nor closing prices are used to obtain these extreme price points.


More Updates are coming soon, Including Market Summary on the Main Window and criteria calculation algorithms for new daily 52Week High/Low prices. 

___________________________________________________________________
Official Site

Direct download

WAP File mailing-list(Please subscribe to receive daily WAP File)
___________________________________________________________________

Sunday, October 6, 2013

BIT Semester 01 -Recommended Readings - Ebooks - Download


It's without a doubt a cumbersome task to find the Electronic versions of recommended books for BIT UCSC Semester 01, or any E book for that matter, hence I thought of sharing what I have found for the benefit of fellow students who following BIT course in UCSC. I haven't been able to find all the books recommended by UCSC , but I'll update the list once I have found others on due course.

I have included following E Books in the compressed file which is available to download.

Last updated on 21.10.2013 : Added OBrien - Introduction to Information Systems [2010].
  • Schaum’s Outlines Series; Basic Mathematics with applications to science and technology. 2nd Edition.
  • O’Brien, J. (2005). Introduction to information systems.12th Edition: Tata McGraw-Hill Publishing Company Limited. 
  • Linda Null and Julia Lobur, Computer Organization and Architecture, Jones 2006 
  • Scott Mueller, Upgrading and Repairing PCs, 18th Edition, QUE Press 2008 
  • Peter Norton, Introduction to Computers, 6th Edition, Tata McGraw-Hill 2005 
  • Web Application Architecture, Leon Shklar& Rich Rosen, John Wiley & Sons, Ltd 2003
  • OBrien - Introduction to Information Systems [2010]


P:S Don't forget to share this link among your fellow students.

Monday, July 22, 2013

JTattoo : Brings a whole new Look and Feel to your J2 applications


Are you fed up with the look and feel of your J2 applications? Well, You are not alone. Originally JDK is shipped with only 03 Look and Feel classes to present UI components in our Java applications (Nimbus,Metal and Motif) or you can use the default system UI by invoking UIManager.getSystemLookAndFeelClassName()).

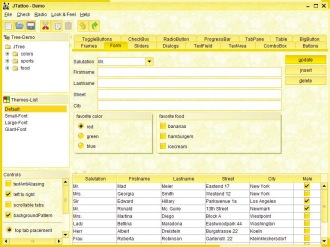
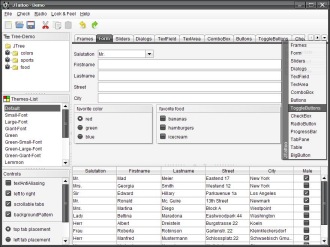
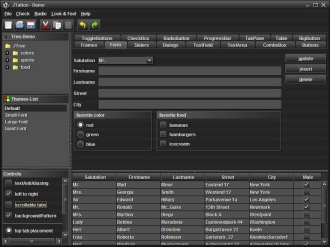
Which brings us to JTattoo , It is Java library of LookAndFeel classes ,and provides us with 13 different look and feel classes to choose from . Users have different life styles and preferences, While some can get along with simple and lightweight themes , some may prefer darker and flashy UIs. By using JTattoo's wide range of options we can let user decide how he wants our J2 applications to look like according to their tastes.

Here are some sample look and feel classes. you can view all available LF classes here.


How to change LookAndFeel Class?
Following code shows how to assign LF classes dynamically. I have chosen 'smart' LF in JTatoo library.

 public void changeLF() {
        try {
            // select Look and Feel for e:g "Smart" LF
            UIManager.setLookAndFeel("com.jtattoo.plaf.smart.SmartLookAndFeel");
            //initialize this frame's UI Trees with the current look and feel.
            SwingUtilities.updateComponentTreeUI(this);            
        }
        catch (Exception ex) {
            //catches UnsupportedLookAndFeelException & ClassNotFoundException
            ex.printStackTrace();
        }
 } // end 

All available LF classes.
  • com.jtattoo.plaf.aero.AeroLookAndFeel
  • com.jtattoo.plaf.acryl.AcrylLookAndFeel
  • com.jtattoo.plaf.fast.FastLookAndFeel
  • com.jtattoo.plaf.mcwin.McWinLookAndFeel
  • com.jtattoo.plaf.mint.MintLookAndFeel
  • com.jtattoo.plaf.smart.SmartLookAndFeel
  • com.jtattoo.plaf.aluminium.AluminiumLookAndFeel
  • com.jtattoo.plaf.bernstein.BernsteinLookAndFeel
  • com.jtattoo.plaf.graphite.GraphiteLookAndFee
  • com.jtattoo.plaf.hifi.HiFiLookAndFeel
  • com.jtattoo.plaf.noire.NoireLookAndFeel"
  • com.jtattoo.plaf.texture.TextureLookAndFeel"

Sunday, June 23, 2013

JStockCharts Update: Combined series chart has been added to Comparable Counters.


Your user friendly charting application has just been updated with a new chart type, It's not an Indicator type but an extremely useful type to render. This chart type is just for the Counter comparison tool and only available therein. Users can select different counters ,select the chart type ( Line(Combined)) for a specific period and press draw button, actually you don't need to select the orientation options for the frame has only one pre configured layout.  
                    Once rendered users are able to view WAP price movements of selected shares for the given period in one plot. Now this is immensely come in handy when you want to compare counters in the same sector , for an example , in the above screenshot I have selected 03 popular banking shares to compare. As always suggestions are welcome to improve this chart type and also make Counter comparison tool more efficient.


___________________________________________________________________
Official Site

Direct download

WAP File mailing-list(Please subscribe to receive daily WAP File)
___________________________________________________________________

Sunday, June 9, 2013

JStockChart: Update Notification - Parabolic SAR Indicator


Developed by Welles Wilder, the Parabolic SAR refers to a price-and-time-based trading system. Wilder called this the "Parabolic Time/Price System." SAR stands for "stop and reverse," which is the actual indicator used in the system. SAR trails price as the trend extends over time.The indicator is below prices when prices are rising and above prices when prices are falling. In this regard, the indicator stops and reverses when the price trend reverses and breaks above or below the indicator.


___________________________________________________________________
Official Site

Direct download

WAP File mailing-list(Please subscribe to receive daily WAP File)
___________________________________________________________________

Sunday, May 26, 2013

JStockCharts Update : Stock Charts Comparison Tool & Mass Index Indicator


Stock Charts Comparison Tool


Comparison Tool  rendered on a 19" widescreen monitor
Stocks (Counters) Comparison tool is the latest addition to JStockCharts and of which I'm really proud of presenting to my users. The knowledge/experience I gained coding this tool is enormous and Even I'm genuinely thrilled to write this blogpost about it.
             Essentially , using this tool users can select up to 06 shares , select a specific chart type/indicator , select a specific period and draw charts for them separately as depicted in the screenshot, this shall be usefull when it comes to observe sector wise trends and I intend to improvise this tool more by letting users to save selections in persistent state so that they can be observed time to time, as is the case of ever changing stock market.
               Actually there is no theoretical limitation to the number of shares that can be compared, but I have put up this limitation of 06 counters to render charts more clearly on single monitor systems, I'm afraid most people use notebook computers hence even 06 charts wouldn't be clearly analyzable. Feel free to try this an new ideas and suggestions are always welcome and would be highly appreciated.
New Indicator : Mass Index


Developed by Donald Dorsey, the Mass Index uses the high-low range to identify trend reversals based on range expansions. In this sense, the Mass Index is a volatility indicator that does not have a directional bias. Instead, the Mass Index identifies range bulges that can foreshadow a reversal of the current trend.


___________________________________________________________________
Official Site

Direct download

WAP File mailing-list(Please subscribe to receive daily WAP File)
___________________________________________________________________


Saturday, May 25, 2013

JD-GUI , A lightweight java decompiler


JD-GUI is a standalone graphical utility that displays Java source codes of “.class” or ".jar" files . You can browse the reconstructed source code with the JD-GUI for instant access to methods and fields. This is a free tool for non-commercial use. I can guarantee you it's fast and reliable tool. I have been using it for couple weeks now and I'm totally contented with it.
JD-GUI is free for non-commercial use. This means that JD-GUI shall not be included or embedded into commercial software products. Nevertheless, this project may be freely used for personal needs in a commercial or non-commercial environments.


JD-GUI is can be downloaded by visiting it's official site and is available for Windows, Linux and Mac platforms. 

Main Features

  • JD-Core and JD-GUI are written in C++. This allows an extremely fast decompilation and a display.
  • JD-Core does not require the Java runtime environment for its functioning, therefore no special setup is required.
  • JD-Core works with most current compilers including the following:
    • jdk1.1.8
    • jdk1.3.1
    • jdk1.4.2
    • jdk1.5.0
    • jdk1.6.0
    • jdk1.7.0
    • jikes-1.22
    • harmony-jdk-r533500
    • Eclipse Java Compiler v_677_R32x, 3.2.1 release
    • jrockit90_150_06
  • JD-Core supports the following new features of Java 5:
    • Annotations
    • Generics
    • Type “enum”
  • JD-GUI supports Drag and Drop.
  • JD-GUI supports JAR files.
  • JD-GUI displays color coded Java source code.
  • JD-GUI allows you to browse the “class” files hierarchy.
  • JD-GUI displays “log” files, and allow you to decompile “class” files appearing in Java stack traces.
  • JD-Core, JD-GUI and JD-Eclipse use the excellent cross-platform wxWidgets toolkit.


Sunday, May 19, 2013

JStockCharts Update- Ease of Movement Indicator


Ease of Movement Indicator (EMV)


Developed by Richard Arms, Ease of Movement (EMV) is a volume-based oscillator that fluctuates above and below the zero line. As its name implies, it is designed to measure the "ease" of price movement. Arms created Equivolume charts to visually display price ranges and volume. Ease of Movement takes Equivolume to the next level by quantifying the price/volume relationship and showing the results as an oscillator. In general, prices are advancing with relative ease when the oscillator is in positive territory. Conversely, prices are declining with relative ease when the oscillator is in negative territory.


JStockCharts provides 14 day SMA of EMV. Users must select a period higher than or equal to 03 month to render this chart type.

Further I have optimized the code of WatchList to ensure more effectiveness of the data displayed in it. for an example I have added a no change color (orange) for two types of changes in closing price. first , If there were no trades for the last trading day or previous trading date for a given counter, there is no point of calculating the change hence such counters rendered in no change color. and second is the most obvious , of which closing prices were same for the two days. 
In the following screen capture HSIG's closing price shows as 0.00 because it hasn't been traded for the last updated trading date. other three counter's are self explanatory.


___________________________________________________________________
Official Site

Direct download

WAP File mailing-list(Please subscribe to receive daily WAP File)
___________________________________________________________________


Sunday, May 5, 2013

JStockCharts update- Aroon Indicator & StochRSI Charts


Aroon Indicator
Developed by Tushar Chande in 1995, Aroon is an indicator system that determines whether a stock is trending or not and how strong the trend is. "Aroon" means "Dawn's Early Light" in Sanskrit. Chande chose this name because the indicators are designed to reveal the beginning of a new trend. The Aroon indicators measure the number of periods since price recorded an x-day high or low.


StochRSI
Developed by Tushard Chande and Stanley Kroll, StochRSI is an oscillator that measures the level of RSI relative to its high-low range over a set time period. StochRSI applies the Stochastics formula to RSI values, instead of price values. This makes it an indicator of an indicator. The result is an oscillator that fluctuates between 0 and 1.


___________________________________________________________________
Official Site

Direct download

WAP File mailing-list(Please subscribe to receive daily WAP File)
____________________________________________________________________________


Sunday, April 28, 2013

JStockCharts update- WatchList & Percentage Price Oscillator Chart


If you are new to JStockCharts please refer to this post.

I have been working on a way to enable users to save his favorite/holding shares and daily monitor their trading summary through a single window. The Latest feature of the JStockCharts , WatchList enables users to accomplish this task. It simply provides a window to add/remove your desired shares to the table on the right side, once you updated the latest price list to the application you can go ahead and analyze the trading summary of the shares in your watchList easily by clicking the ico_alpha_ClipboardEdit_24x24 icon in the toolbar or by going through Tools menu.

wl

Technical Indicator – PPO ( Percentage Price Oscillator)
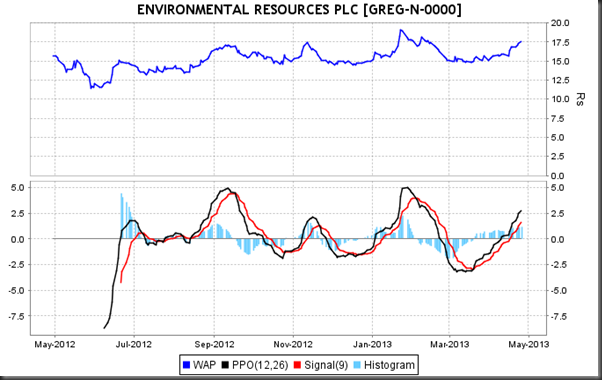
The Percentage Price Oscillator (PPO) is a momentum oscillator that measures the difference between two moving averages as a percentage of the larger moving average. As with its cousin, MACD, the Percentage Price Oscillator is shown with a signal line, a histogram and a centerline. Signals are generated with signal line crossovers, centerline crossovers and divergences. Because these signals are no different than those associated with MACD, this article will focus on a few differences between the two. First, PPO readings are not subject to the price level of the security. Second, PPO readings for different securities can be compared, even when there are large differences in the price.
Reference : StockCharts.com
This useful indicator charts are available for over 03 Months periods.

ppo

___________________________________________________________________
Official Site
http://wkhhost.hostoi.com/JChartsWeb/index.html

Direct download
https://sourceforge.net/projects/jchartscse/files/latest/download

WAP File mailing-list(Please subscribe to receive daily WAP File)
https://lists.sourceforge.net/lists/listinfo/jchartscse-wapfeed
____________________________________________________________________________

Monday, April 8, 2013

Introducing JStockCharts - Technical Analysis tool for Equity trading in Colombo Stock Exchange (CSE)


JStockCharts is a java based charting application with added features such signal generator and historical price viewer, chart comparison tool. Supports all widely used technical indicators. The system uses a local database to which a price list (WAP File) shall be uploaded daily. The file can be obtained by subscribing to the wap feed mailing-list.


Available chart types
Following chart types are available if you select over 03 months time period. This list grows frequently so make sure to subscribe to my blog to receive updates about new additions to the application and chart types.


Sample Charts
Price & Turnover

Relative Strength Index

Ease of Movement
       

Candlestick Chart


Technical indicator value generator

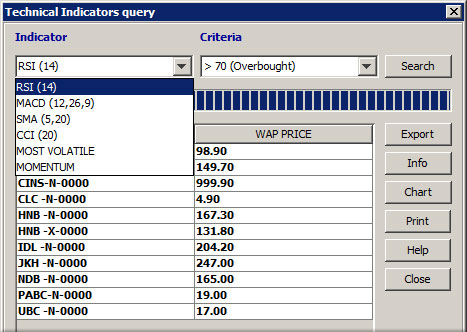
Using this tool users can query for counters which meet certain criteria such as , this list keeps getting longer with weekly updates. (subscribe to the official mailing-list to receive update notifications)

  • MACD crossing the signal line from below , from above etc
  • RSI overbought/oversold counters
  • SMA - Cross from below/above
  • CCI - overbought/oversold 
  • Volatility
  • Momentum
  • New 52Week High/Low


Historical Prices

This tool enables users to

  • View OHLC , Turnover and Volume data for a specific counter for a specific date or for  a date range and all counters for a specific date or date range. 
  • View High Low prices for all counters or a selected counter (Highs & Lows) ,
  • View if a selected counter recorded a given gain percentage over a specific time period. (Gain Analyzer)


Counter Comparison Tool

This too enables users to compare various shares in a single window. select shares , select a chart type , select a grid type and you are provided with multiple charts withing the same container. Also users are able to draw line charts of different counters in the same plot (Line (Combined)).


Line (Combined) Chart type
_________________________________________________________________
Official Site
http://wkhhost.hostoi.com/JChartsWeb/index.html

Direct download
https://sourceforge.net/projects/jchartscse/files/latest/download

WAP File mailing-list(Please subscribe to receive daily WAP File)
https://lists.sourceforge.net/lists/listinfo/jchartscse-wapfeed
_________________________________________________________________

System Requirements:
*. Java Run-time version 7 or above (Download)
*. Supported Operating Systems : Windows XP or above, Linux , MAC OS X, Solrais

Installation
No installation is required , you can use this as a portable application.

1. Download JStockCharts.rar by visiting the above direct download link.
2. Extract the downloaded file in to a desired location (e.g C:\)
3. Add shortcut to the JStockCharts.exe file to the desktop.
4. Run the application using the above shortcut.

Enjoy!!

Google+ 
 
 
Blogger Templates http://slots.to/